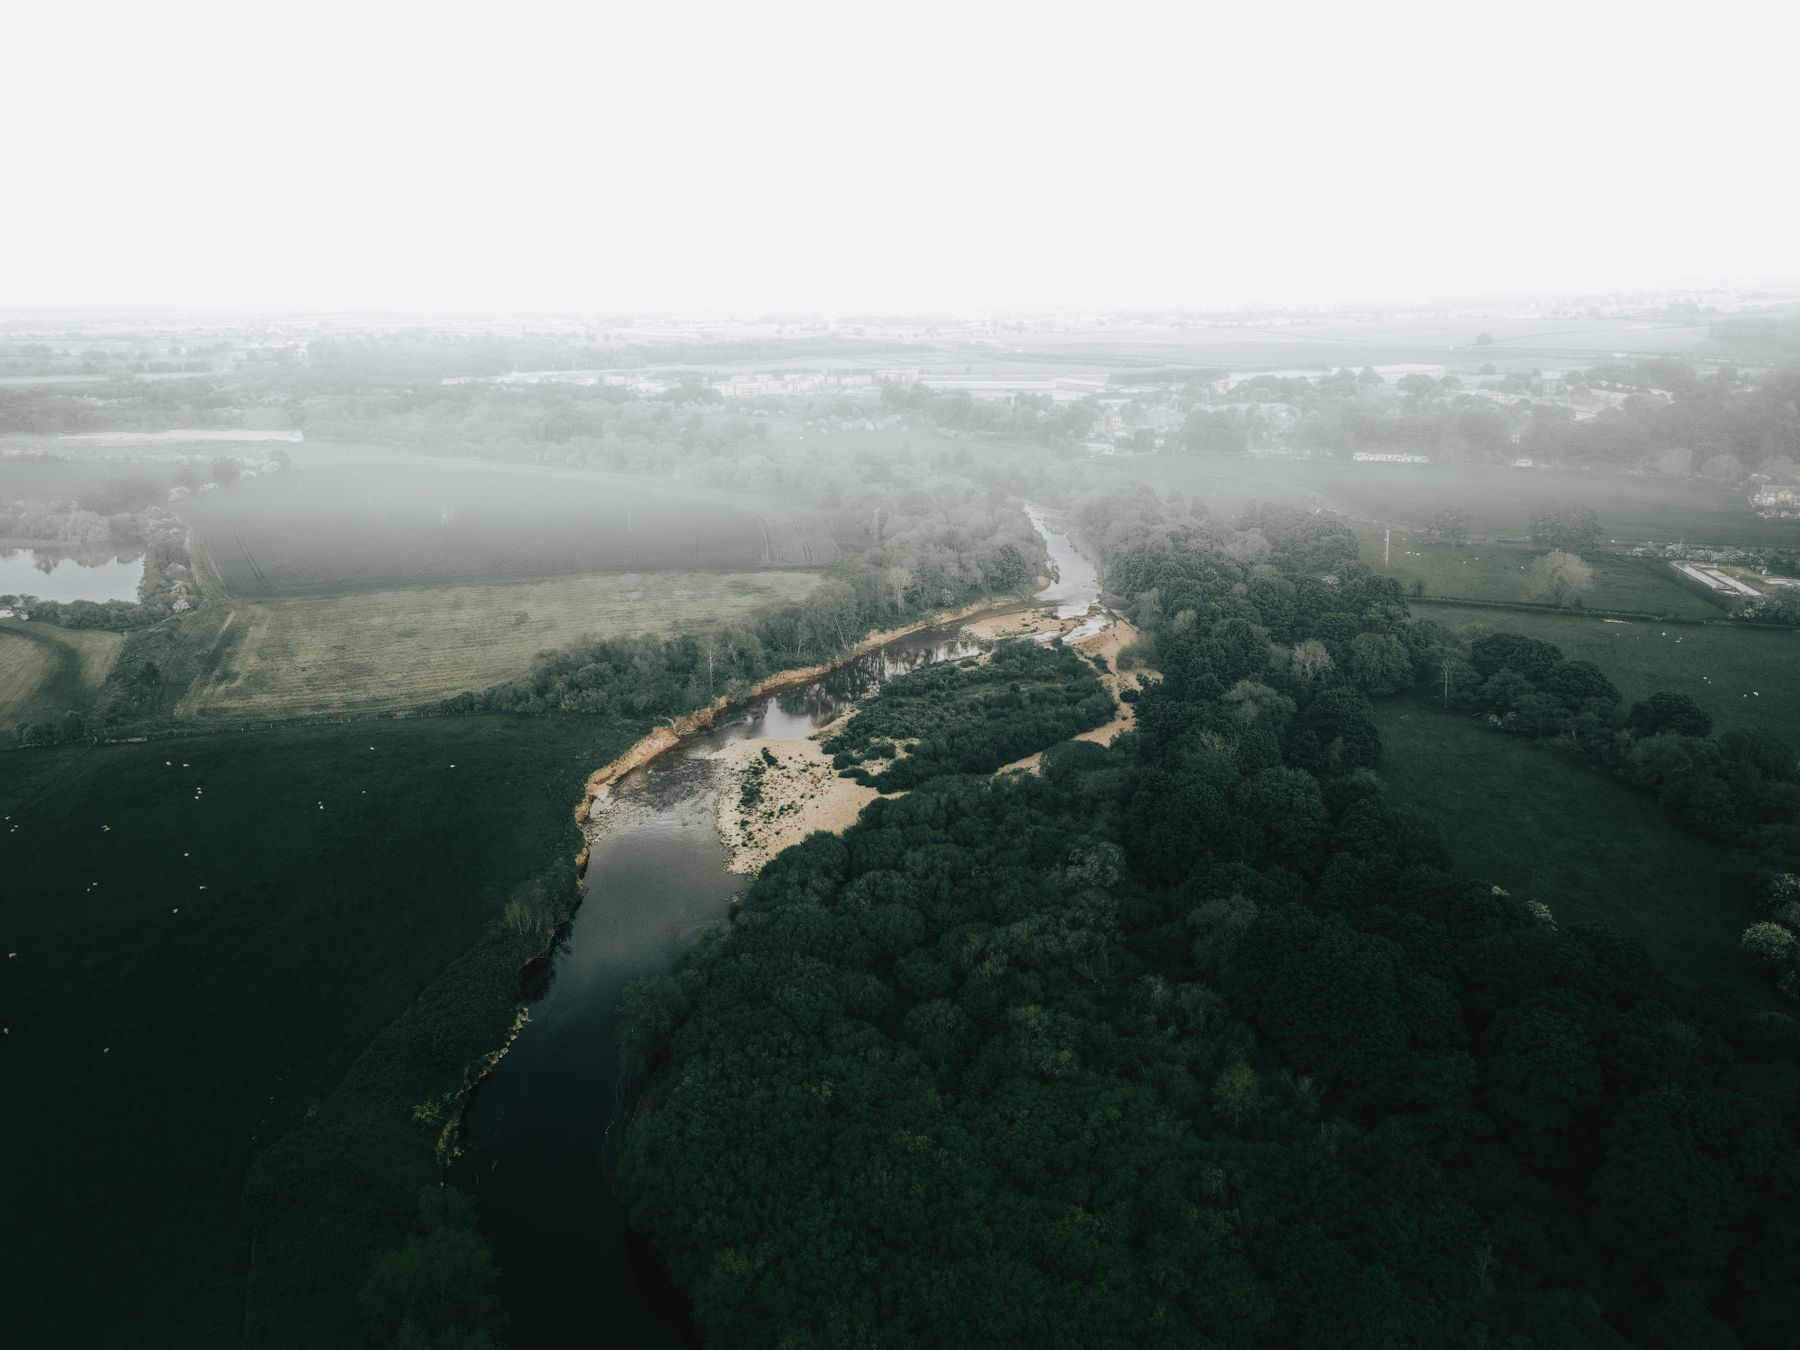
In August 2026 the Environment Agency published its first full assessment of England’s waters in six years. What follows is that record, alongside the state of the soil the water runs off. Every figure comes from the Environment Agency, Defra, Ofwat, Parliament or the research institutions themselves, and every numbered figure links to the source list in The water companies, on the record, the article that also holds the companies’ court record, where the money went and the cancelled tests.
All 4,658 surface water bodies in England were assessed against standards covering wildlife, water quality and physical habitat. These are the results as published.
| Figure | What it measures | Source |
|---|---|---|
| 14.3% | of surface waters are in good ecological condition | Environment Agency1 |
| 100% | of surface waters fail chemical status. Not one passed | Environment Agency1 |
| 65.4% | are classified moderate, with a further 17% poor and 3.1% bad | Environment Agency1 |
| 55% | of river water bodies fail the phosphorus standard for good status | Environment Agency4 |
| 86% | of tested water bodies fail on at least one indicator | The Rivers Trust3 |
| 41% | of groundwater bodies are in good condition, up from 37% in 2019 | Environment Agency1 |
Phosphate, which comes from sewage and from farm run-off, was named the single biggest problem of all. The assessment also updated its methods, so the Environment Agency states these results are not directly comparable with the 2019 figures.1
These are the responses most often given when the figures above come up. Each one is accurate and each one is published. Each also has an answer drawn from the very same official sources.
“Eighty-two per cent of individual ecological indicators are good or high. The overall status of a water body is set by its lowest scoring element, and around a third of failures come down to a single element.”
Close to eighty-six per cent of tested water bodies still fail on at least one indicator. A river is not healthy because most of its readings are acceptable. It is healthy when none of them are failing.
“Germany achieves eight per cent good ecological status and the Netherlands one per cent.” The comparison appears in the Environment Agency’s own announcement of the results.
That is a comparison with other countries’ failures, not a defence of our own. It does not make a stream in Warwickshire any cleaner, and it is not an argument any of us would accept about the air we breathe or the water we drink.
Sewage spills fell sharply. In 2025 there were about 291,000 spill events lasting roughly 1.9 million hours, down from a record 3.6 million hours in 2024. Spills per overflow fell from 31.8 to 20.5.
This is true, and it is the most important fact on this page. Spill hours nearly halved, helped by an unusually dry year, and the water still failed. Fourteen per cent in good condition. None passing chemical status. Just 79 overflows, about half of one per cent, improved because of regulation.
The pipe was never the whole problem. The spills went down and the rivers did not get better, because nothing changed on the land the rain falls on.
Why this has to be treated at the fieldEach year the Environment Agency publishes an Environmental Performance Assessment, rating every water and sewerage company in England from one star, poor, to four stars, industry leading. The 2024 assessment, published in October 2025, was the worst in the fourteen years the scheme has run. The sector average was 2.11 stars.22
| Company | 2024 rating | 2023 | What changed |
|---|---|---|---|
| Severn Trent Water | 4 stars | 4 stars | The only company rated industry leading, and it held that rating |
| Anglian Water | 2 stars | 2 stars | Requires improvement, unchanged |
| Northumbrian Water | 2 stars | 3 stars | Fell a star |
| Southern Water | 2 stars | 2 stars | Requires improvement, unchanged |
| South West Water | 2 stars | 2 stars | Requires improvement, unchanged |
| United Utilities | 2 stars | 4 stars | Fell two stars in a single year |
| Wessex Water | 2 stars | 4 stars | Fell two stars in a single year |
| Yorkshire Water | 2 stars | 2 stars | Requires improvement, unchanged |
| Thames Water | 1 star | 2 stars | Poor, the lowest rating the assessment gives |
Environment Agency, Environmental Performance Assessment star ratings 2011 to 2024, published 23 October 2025.22 The sector total fell from 25 stars to 19, the lowest since the assessment began in 2011.23
Seventy-five serious pollution incidents in 2024, against 47 the year before. Three companies caused 81 per cent of them: Thames 33, Southern 15 and Yorkshire 13. Total incidents rose 29 per cent to 2,801.7
Of the water company sites the Environment Agency inspected, 24 per cent were found to be in breach of the permit that allows them to operate at all.7
United Utilities and Wessex Water were both rated industry leading in 2023. Both fell to two stars in 2024. Neither held its rating for a second year.22
In the summer of 2025 the Environment Agency paused around ten thousand of its own water quality tests for lack of staff, and the Office for Environmental Protection found that the regulators themselves had broken environmental law. The full account, with the court record, the pollution incidents and where the money went, is in The water companies, on the record.
That is how Janina Gray of WildFish described the routine monitoring that was paused. Jo Bradley of Stormwater Shepherds said failing to test leaves a gaping hole in our understanding of river health.10
The Rivers Trust criticises risk-based monitoring for leaving out rivers deemed low risk, an outdated list of tested chemicals, and the fact that the sites behind a classification are never published.3
In July 2025 the Office for Environmental Protection found that Defra, Ofwat and the Environment Agency had all failed to comply with environmental law in their regulation of combined sewer overflows. It closed the case only after corrective action was taken.24
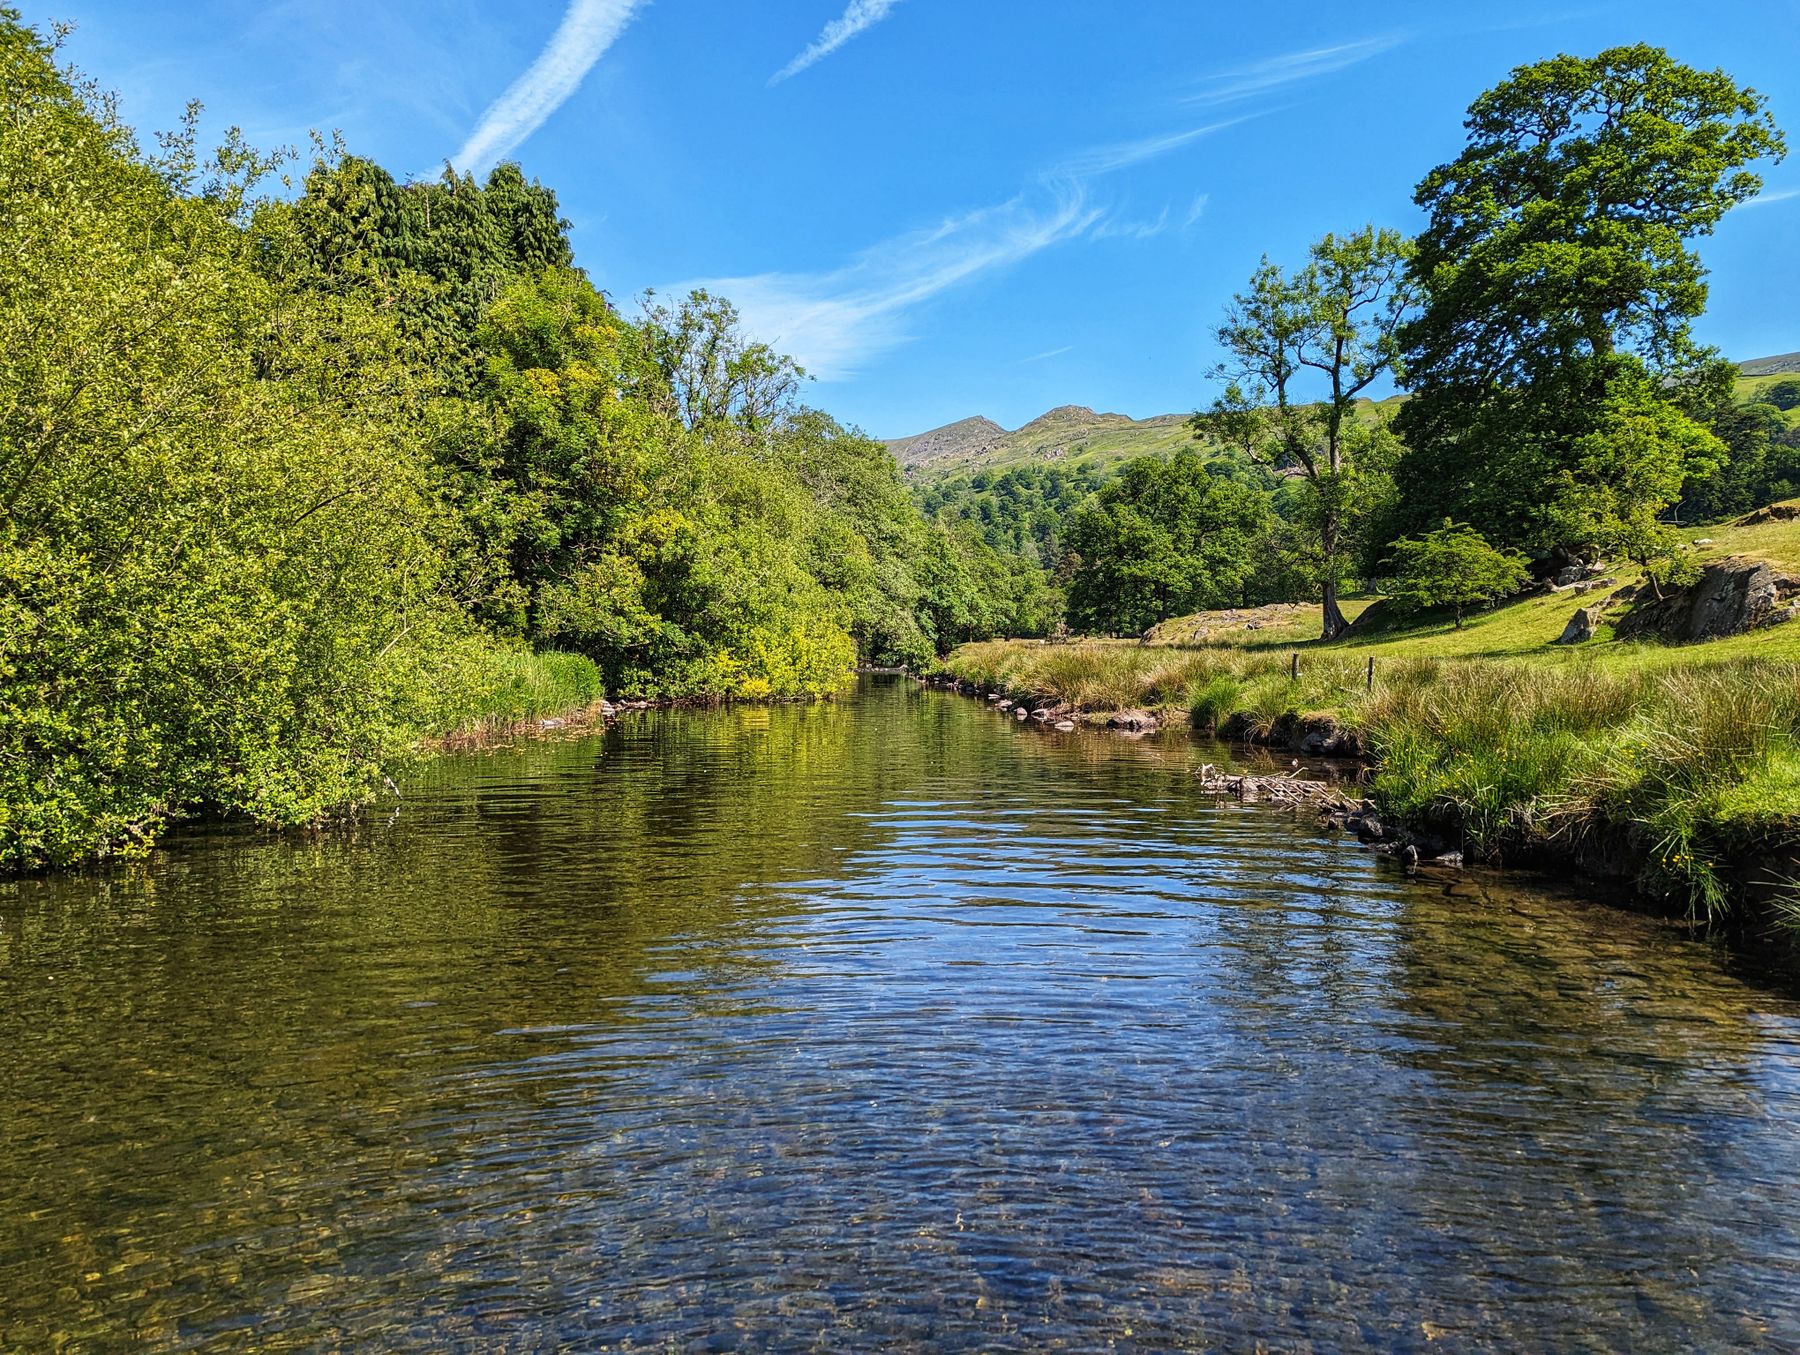
| Figure | What it measures | Source |
|---|---|---|
| Lowest ever | Atlantic salmon stocks in England, the lowest since records began | EA and Cefas15 |
| 90% | of England’s principal salmon rivers are classed at risk or probably at risk | EA and Cefas15 |
| 187 | salmon returned to the River Itchen in 2024, the third lowest count ever recorded | Wildlife Trust16 |
| 85% | of the world’s chalk streams are in England, which makes them ours to lose | Wildlife Trust16 |
| 62% | fall in England’s farmland bird populations since the 1970s, and 11% in the last five years alone | RSPB and Defra17 |
| 78% | fall in flying insect abundance measured on vehicle number plates between 2004 and 2023 | Bugs Matter18 |
| 19% | average fall in UK species abundance since 1970 across more than 10,000 species. One in six is now threatened with extinction | State of Nature18 |
This is perhaps the plainest measure of the gap between the official rating and what is actually in the water. People got sick where the state had already said it was fine.
| Figure | What it measures | Source |
|---|---|---|
| 1,236 | people reported falling ill after entering the water in England in 2025 | Surfers Against Sewage19 |
| 74% | of those cases happened at bathing waters officially rated good or excellent | Surfers Against Sewage19 |
| 1,853 | sickness reports in 2024, an average of five people every day | Surfers Against Sewage19 |
| 331 | of those had to see a doctor, and 79% said the doctor attributed the illness to sewage pollution | Surfers Against Sewage19 |
| 124,000 | hours of sewage pollution at England’s designated bathing waters in 2025 | Surfers Against Sewage20 |
| 32 | bathing waters were still rated poor in 2025 | Environment Agency21 |
In June 2019 the Environment Agency published The state of the environment: soil. It remains the most authoritative account of English soil there is, and it was written by the body responsible for protecting it.
Soil carbon loss is an act of economic and environmental self-harm.
Emma Howard Boyd, then Chair of the Environment Agency, June 201911| Figure | What it measures | Source |
|---|---|---|
| £1.2bn | the annual cost of soil degradation in England and Wales | Environment Agency11 |
| 2.9m t | of topsoil lost to erosion in England and Wales every year | Environment Agency11 |
| £177m | the annual cost of erosion alone in England and Wales | Environment Agency11 |
| 4m ha | almost four million hectares at risk of compaction | Environment Agency11 |
| 2m ha | over two million hectares at risk of erosion | Environment Agency11 |
| 40 to 60% | of their organic carbon lost by arable soils, through intensive farming | Environment Agency11 |
| 80% | of surface run-off in fields caused by poor tramline practice | Environment Agency11 |
| 30 to 60 yrs | until the fundamental eradication of soil fertility in parts of the country such as the fenland peats | Environment Agency11 |
| 38% | of arable soils in England and Wales classed as degraded, against under 7% of grassland and woodland | Rothamsted Research12 |
| £3.21bn | the annual cost to the UK of soil carbon loss | Sustainable Food Trust13 |
The 25 Year Environment Plan set out to reverse soil degradation and restore fertility by 2030. A year later the Environment Agency stated plainly that there is insufficient data on the health of our soils. That deadline is now four years away.11
UK soils hold about ten billion tonnes of carbon, roughly eighty years of the country’s annual greenhouse gas emissions, and soil holds three times as much carbon as the atmosphere.11
Soil organic matter can hold up to twenty times its own weight in water and makes ground more resistant to drought and erosion. Losing it is how a field starts shedding rain instead of holding it.11
Parliament reached the same conclusion. The Environment, Food and Rural Affairs Committee found UK soil heavily degraded through over-use, erosion, compaction and pollution, and called for statutory soil targets carrying the same legal weight as water and air quality.14 The Rothamsted figure is drawn from a national soil survey whose samples were collected between 1978 and 1983.12
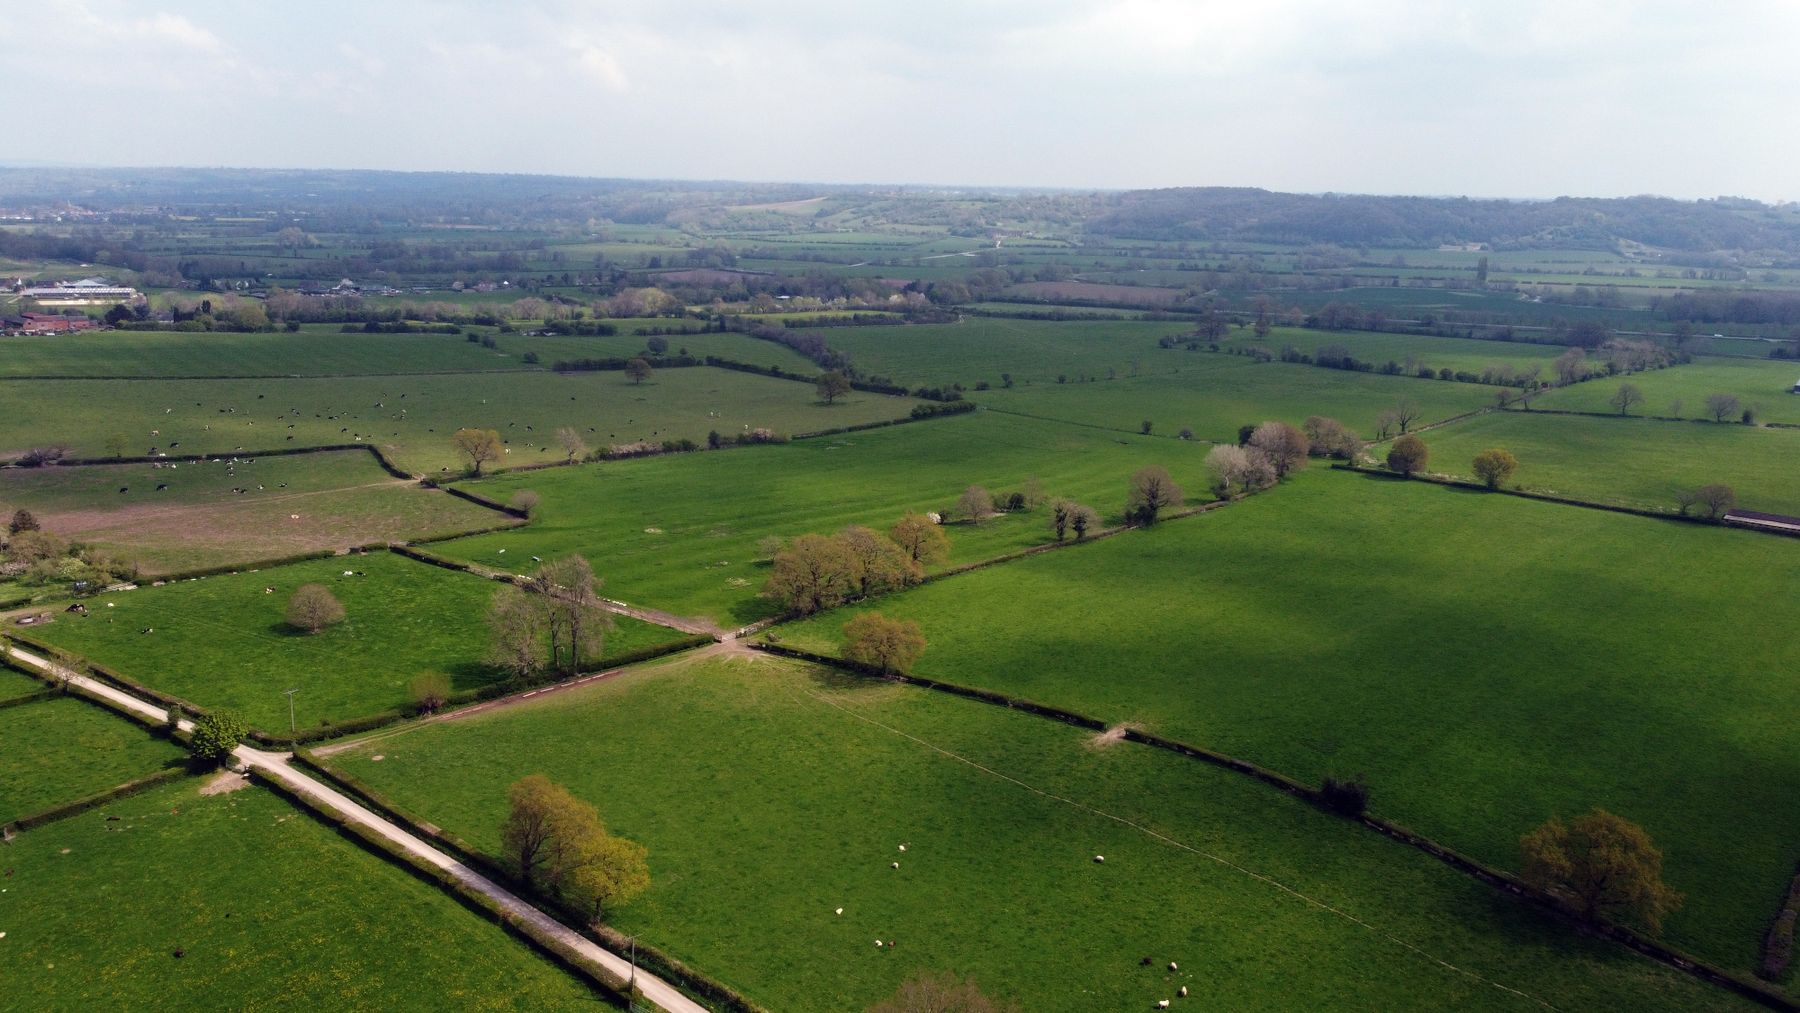
These are Defra and Environment Agency figures on what agriculture contributes to the state of the water. None of it can be treated downstream, because it never reaches a pipe. It can only be held in the soil, in the field it comes from, and that is the work of this initiative. Farmers are not the problem here. They are the people who can fix it, and it has to make sense on the farm for the change to last.
| Figure | What it measures | Source |
|---|---|---|
| 40% | of water bodies in England are adversely affected by agriculture | Defra and EA8 |
| 60% | of the nitrogen in rivers in England and Wales comes from agriculture, and none of it passes through a treatment works | Defra and EA8 |
| 28% | of the phosphorus in rivers in England and Wales comes from agriculture | Defra and EA8 |
| 68% | of England’s land is farmed, which is why the land is where the leverage is | Defra and EA8 |
| 55% | of England is designated a Nitrate Vulnerable Zone, so the ground that needs the work is already mapped | Defra9 |
More than nineteen thousand farm inspections in five years, nearly 27,500 improvement actions and 36 prosecutions, and the share of farms found wanting has barely moved: 52%, 49%, 50%, 49% and 43%. Rules on their own do not change what comes off a field.8
The land stays in full production. What changes is the soil underneath the crop, rebuilt so it holds its rain and its nutrients, and the farmer sees that change in their own fields and their own inputs. That is what makes it last.
Sewage is fixed in concrete and steel, over decades, at the bill payer’s expense. The farm share is fixed in the soil, in the field it comes from, one season at a time, and it can start now.
Sixty per cent of the nitrogen arriving in England’s rivers comes off farmland, and no amount of investment downstream can reach it. It has to be held in the ground before it ever starts moving, which means the soil itself has to change.
That is the whole of our work. We build farmland soil back to life so it behaves like a sponge, soaking rainfall in and holding nutrients where the crop can use them rather than letting them wash away. It is done field by field and catchment by catchment, the land stays in full production throughout, and the change is measured in the soil and in the water.
Every numbered figure on this page links to the list of forty published sources at the foot of The water companies, on the record.